Language
Automatic Fault Demarcation and Localization Based on Customer Experience
Release Date:2016-11-15
By Xu Baode, Wu Jiangtao
With the development of data services and the evolution of network structures, the traditional network fault analysis can’t adapt to the current rapid changing network environment; therefore, reform is the general trend.
To date, big data has enabled operators to handle mass data rapidly through a distributed parallel big-data processing mechanism, which lays a technological foundation for operators to analyze, demarcate and locate faults based on customer experience rather than network.
Basic Idea of Fault Demarcation and Localization
Customers are generating various service data from time to time. When a service fails, it is necessary to find out the causes. In the traditional pyramid (top-down) analysis, we first get the proportion of index error from upper layers to lower layers of the network. Generally, the analysis is in the following sequence: the entire network → network elements (NEs) of the core network → the indexes of the radio cells interacting with the NEs of the core network.
After the trouble spots with bad indexes are determined, we then obtain the original call detail records (CDRs) and original signaling to analyze and determine the fault causes.
The traditional pyramid analysis has the following disadvantages:
● It is started from the upper layer index, which is a comprehensive calculation result of a large number of samples. Thus, the index is not sensitive to a few errors.
● It heavily depends on isolated points. Thus, it is inefficient when the differences among indexes are not so obvious.
● The 4G network is flat, the core network devices are organized in a pool, and the hierarchical relationship among network devices has become more complex. Therefore, it is difficult to locate faults level by level.
● It is not intuitive enough to present abnormal indexes, and much manpower is required to demarcate and locate the faults.
Therefore, the pyramid analysis can’t meet the requirements of network evolution. Operators need a new fault demarcation and localization technology, which is customer experience-oriented and based on big data analysis. Compared with the traditional pyramid analysis, the new one is called reversed-pyramid (bottom-up) analysis.
With the reversed-pyramid analysis, the trouble spots with bad indexes can be directly demarcated and located in accordance with abnormal CDRs, and then the fault causes can be determined. In other words, the NEs to be optimized can be deduced from root causes.
The reversed-pyramid analysis is started from the original CDRs. Each CDR is checked to see whether it is normal. If not, the following questions need to be answered: what are the errors? which KPIs and services are affected? what are the causes of the errors? After analysis, all abnormal CDRs and error causes can be determined.
Data Collection and Processing
As the data at the radio side is eNodeB interconnection data, probes are not required in data collection and processing, and the eNodeBs of different vendors can be interconnected through public or private interfaces. The control-plane and user-plane data at the core network side is collected through probes, not restricted by equipment types or vendors. The collected data is output to the big data platform, on which data association, cleansing, and statistics are implemented (Fig. 1).
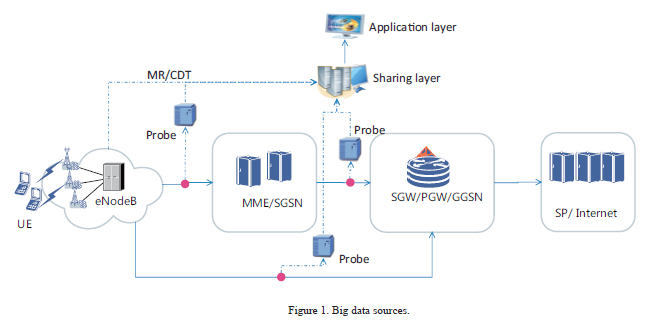
After data is collected to the big data platform, the CDRs of the core network are associated with the radio side, and end-to-end CDRs are generated and saved. Then, data is analyzed by the reversed-pyramid method. Because a fault may occur at different stages of a service, each stage needs to be checked.
● Determine whether the radio indexes are normal. If not, the number of fault causes at the radio side is incremented by one.
● Determine whether the internet DNS/SP node is faulty at the internet side. The interaction and changes (in busy hours and idle hours) of DNS, TCP and GET needs to be analyzed. If there is any error, the number of fault causes at the internet side is incremented by one.
● Check the indexes of NEs at the core network side, including SGW and MME, throughout the day and their changes in busy and idle hours. If there is any error, the number of fault causes at the core network side is incremented by one.
● Periodically maintain and update the information of a faulty UE at the UE side. (Note: A UE is faulty if it has had bad indexes within a certain period continuously.) If the UE fault can be found in the faulty UE information table, the number of fault causes at the UE side is incremented by one.
If no faulty node is found in the above process, it is concluded that the fault is due to other causes.
After the above analysis, statistics on the abnormal CDRs is collected to produce useful data, including the proportion of problems at different stages, the proportion of causes at different stages, numbers of users and CDRs affected by each faulty NE and area. In other words, the severity of problems is quantified to provide reference to determining whether an area is faulty.
Application
Figure 2 shows the proportion of causes for abnormal CDRs obtained from the big data platform of a province of China. Most faults are occurred at the radio side and internet side.
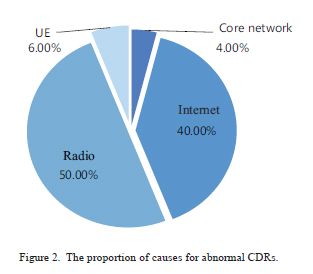
● At the radio side, automatic fault demarcation and localization indicates that most faults are due to weak coverage.
● At the internet side, automatic fault demarcation and localization indicates that most faults are due to the remote distance of some foreign SPs, and packet loss and heavy load of some domestic SPs during network transmission.
● At the UE side, it is found that most errors occur on MI handsets. An investigation on consumer groups shows that most of MI handset users are youths. According to a data service statistics on MI handsets, about 55% are instant communication and webpage services, about 10% are large-traffic services such as video and download services, and about 35% are other services.
As the traffic of instant communication and webpage services is relatively small, the measured rate indexes are not high. Though the core network has a stable performance, it sometimes may have load problems in busy hours. Therefore, the results of fault demarcation and localization provide evidence for operators to dispatch lists and solve problems.
Conclusion
The automatic fault demarcation and localization is one of the core technologies of automated network fault analysis, automated network optimization, and unmanned network optimization.
With more than 30 years of experience in terms of network optimization and delivery, ZTE boasts an advanced problem-analysis-experience knowledgebase with mass data and analysis logic. As the big data and artificial intelligence developed, ZTE will surely help operators improve user experience in the future.
With more than 30 years of experience in terms of network optimization and delivery, ZTE boasts an advanced problem-analysis-experience knowledgebase with mass data and analysis logic. As the big data and artificial intelligence developed, ZTE will surely help operators improve user experience in the future.
relative articles